Northwind - SQL and Hypothesis testing
I used the Northwind database to showcase some SQL skills as well as practicing some foundational knowledge of statistical testing. All the coding is done in python.
Initially it may be hard to know where to start when performing hypothesis testing. Do I start proposing questions that I want answers to? Or, do I comb through my data set looking for insight? Fortunately both of these aspects can initially be set-up separately before melding them to form cohesive answers.
::SQL::
To find out “where you are” is a great first step. Take stock.
- Were you given an entity relationship diagram (EDR) of the database you were working with?
- Was there any over all mandate concerning what to do with the database?
- Are you familiar with the processes in which the data was collected?
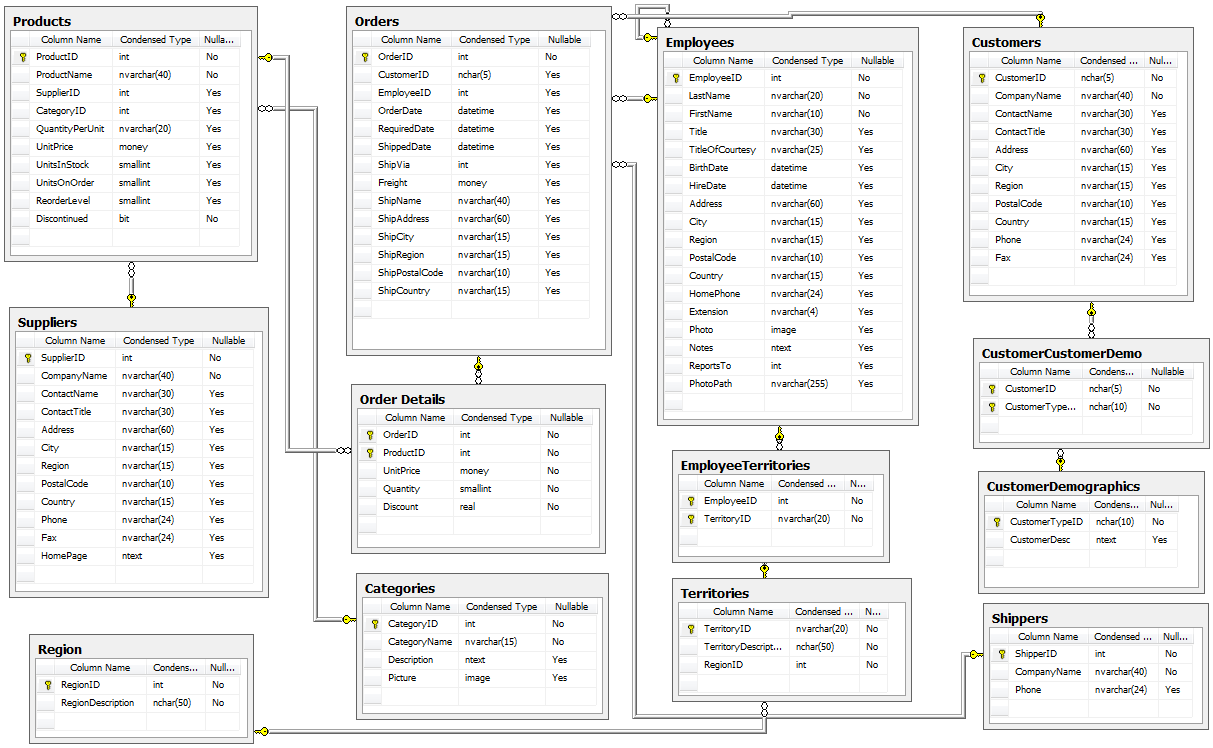
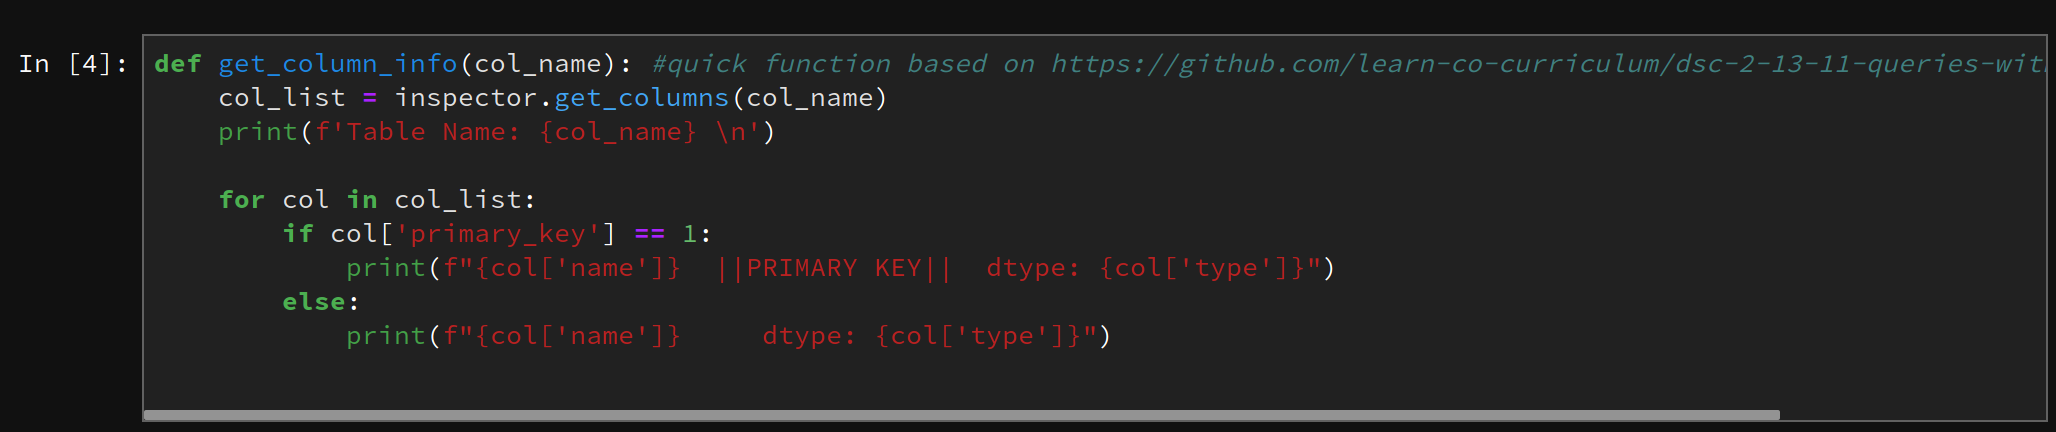
From a quick look at the ERD for the Northwind database, we can start orienting ourselves. We can see what kind of data is stored in Customer table compared to the OrderDetail table, so on and so forth. Since there are a plethora of ways to connect to a database, pick the one you are most comfortable with. I used sqlalchemy. Once connected, start checking the actual tables against the ERD. There could have been a number of different reasons there is a mismatch between a supporting document and database, but it is up to you to find this out. It will save headaches down the line. I modified a function to do most of the heavy lifting for me.

Once the verification of tables, data types, rows, etc has been completed. It is time to shift the focus on what you want to know from the data. Were questions presented to you to answer, or do you have go and discover something novel? In this case, there was one question presented and a mandate to come up with three others.
“Do discounts have a statistically significant effect on the number of products customers order? If so, at what level(s) of discount?”
Before jumping head first into answering a question, I prefer to sketch myself out a road map. I don’t have to worry about making a syntax error or not querying the right data. I can conceptualize how to do it, or if I can do it at all.
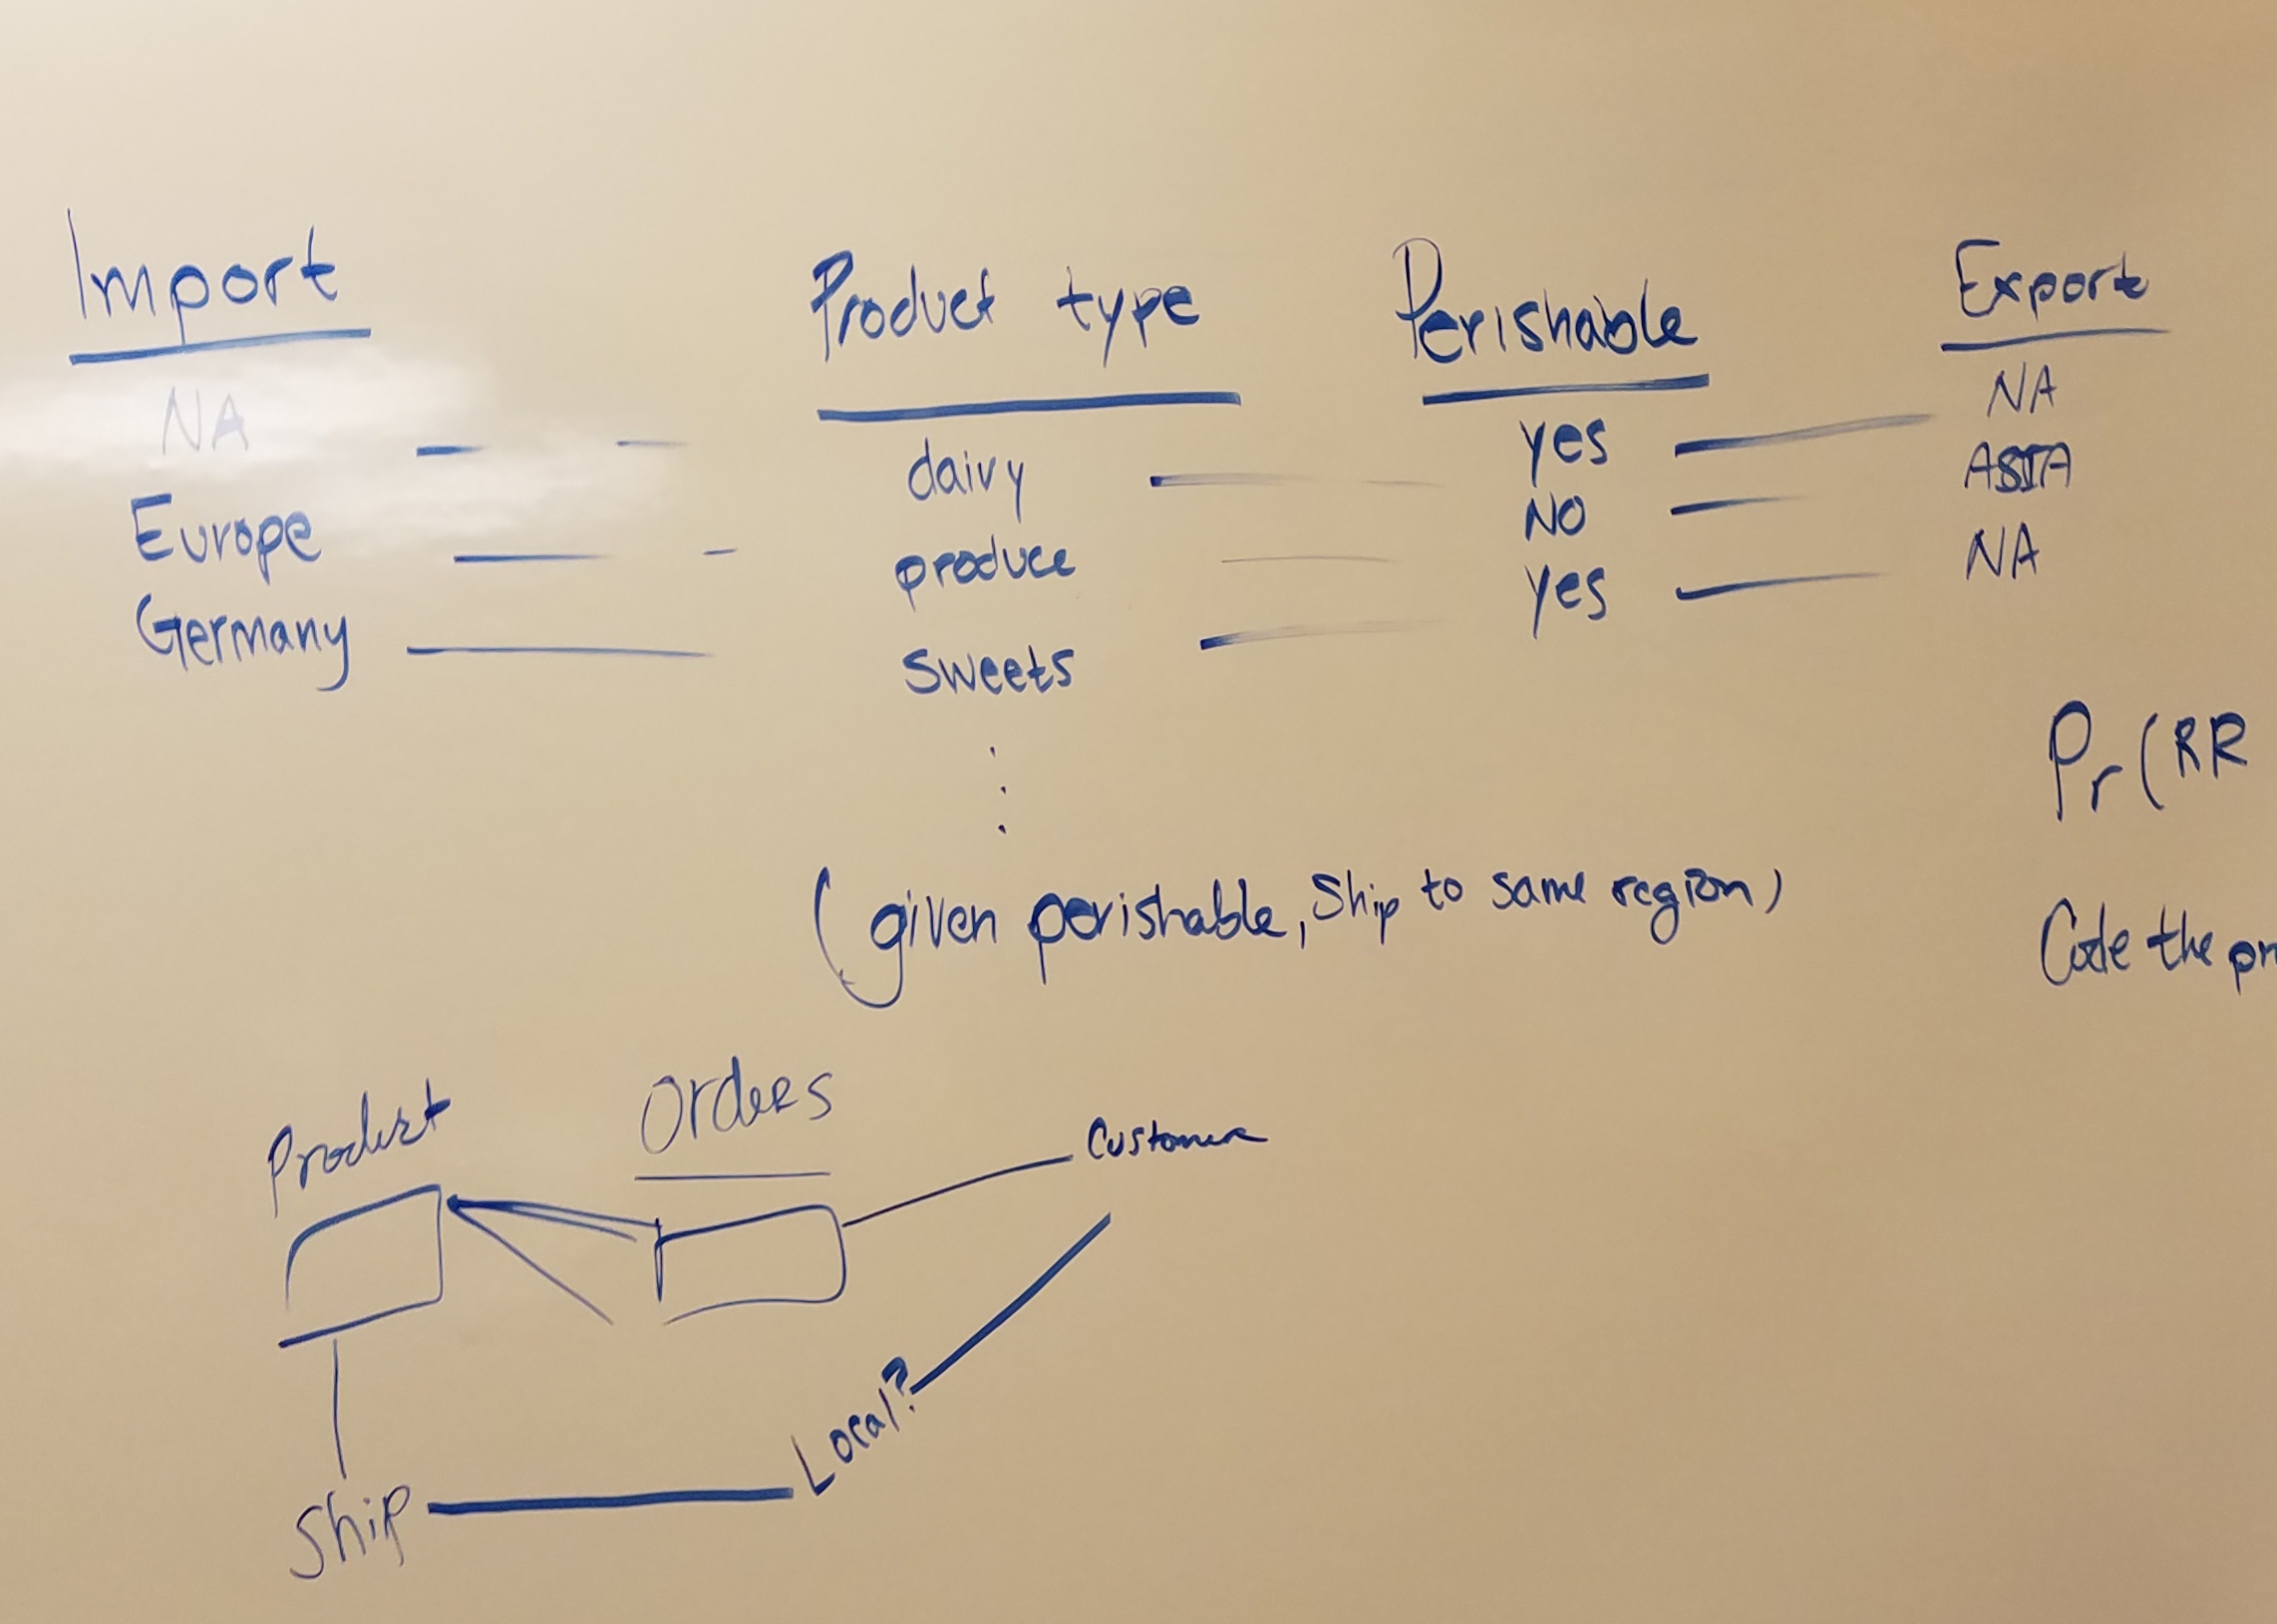
I’ve found when answering one question, more tend to pop up. You gain different insights into the data while working with it rather than just exploring. Don’t discount EDA though, it is still a cornerstone of the data science process.
::Hypothesis Questions::
1) Do discounts have a statistically significant effect on the number of products customers order? If so, at what level(s) of discount?
H null: There is no difference in the number of products customers order given there is a discount
H alt: There is an increase in the number of products customers order given there is a discount
alpha = .05
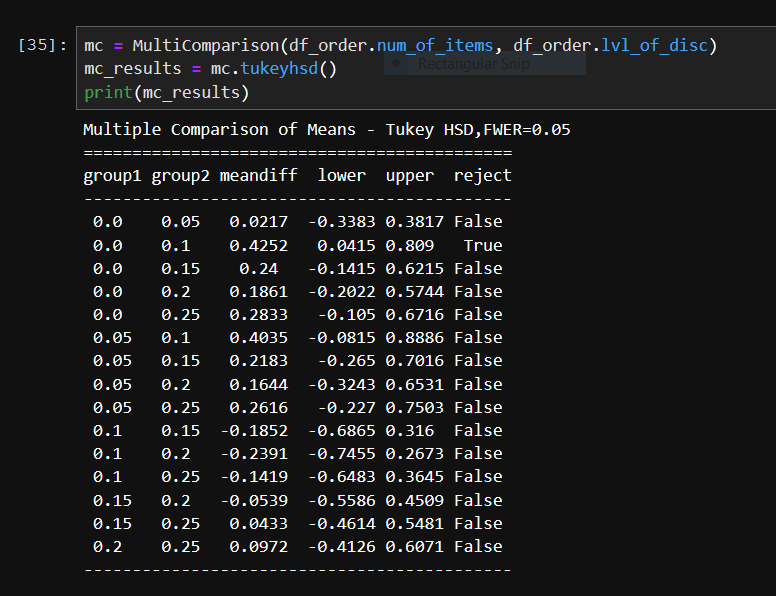
Since there were multiple groups (levels of discount), an ANOVA test would be the best choice to use. The ANOVA test will show if there is a significant difference between no discount and discount. If there is a significant outcome, I plan on using the Tukey HSD (honestly significant difference) test to determine if the relationship between multiple levels of discount are statistically significant. This will be a post hoc test.
1) Results
- I found we can reject our null hypothesis that concludes that there is significant difference between discount and no discount (p-value < alpha :: 0.0106 < 0.05)
- Comparing between the different levels of discount, the greatest effect is seen at no discount to a 10% discount.
- Further testing needs to account for orders with different discount levels within the same order
The following three hypothesis tests I performed, I checked using a parametric test (independent T-test) and a non-parametric test (Mann-Whitney U test).
Independent T-test
Like every test, this inferential statistic test has assumptions. The assumptions that the data must meet in order for the test results to be valid are:
Independent T-test Assumptions
- The samples are independently and randomly drawn
- The distribution of the residuals between the two groups should follow the normal distribution
- The variances between the two groups are equal
The first assumption is met. The second assumption can be suspended given a large enough sample size, therefore independent t-test remains quite robust for violations of normality. More information on this topic has been provided.
Mann–Whitney U test
Mann–Whitney U test is a nonparametric test of the null hypothesis that it is equally likely that a randomly selected value from one sample will be less than or greater than a randomly selected value from a second sample.
Unlike the t-test it does not require the assumption of normal distributions. It is nearly as efficient as the t-test on normal distributions.
Mann-Whitney assumptions:
1) The dependent variable should be measured on an ordinal scale or a continuous scale.
2) The independent variable should be two independent, categorical groups.
3) Observations should be independent. In other words, there should be no relationship between the two groups or within each group.
4) Observations are not normally distributed. However, they should follow the same shape (i.e. both are bell-shaped and skewed left).
Keep in mind that as a parametric test, the independent t-test delivers best and most reliable results if both groups are normally distributed. Reliability decreases for skewed distributions.
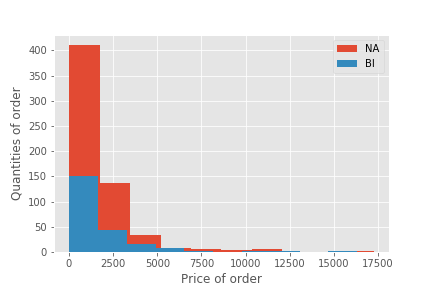
2) Is there a difference in the money generated from sales between the North America office and the British Island office?
H null: The employees based out of the British Island office generates the same amount revenue, per order, than the North American office.
H alt: The employees based out of the British Island office generates less revenue, per order, than the North American office.
alpha = 0.05
2) Results
- Failed to reject the null hypothesis. There is no statistical difference between the median revenues generated by the North American office and the British Island office
- p-value > alpha:: 0.3749 > 0.05 - Mann-Whitney
- p-value > alpha:: 0.7227 > 0.05 - T-test
- Further testing: choosing a different metric and test out hypothesis again.
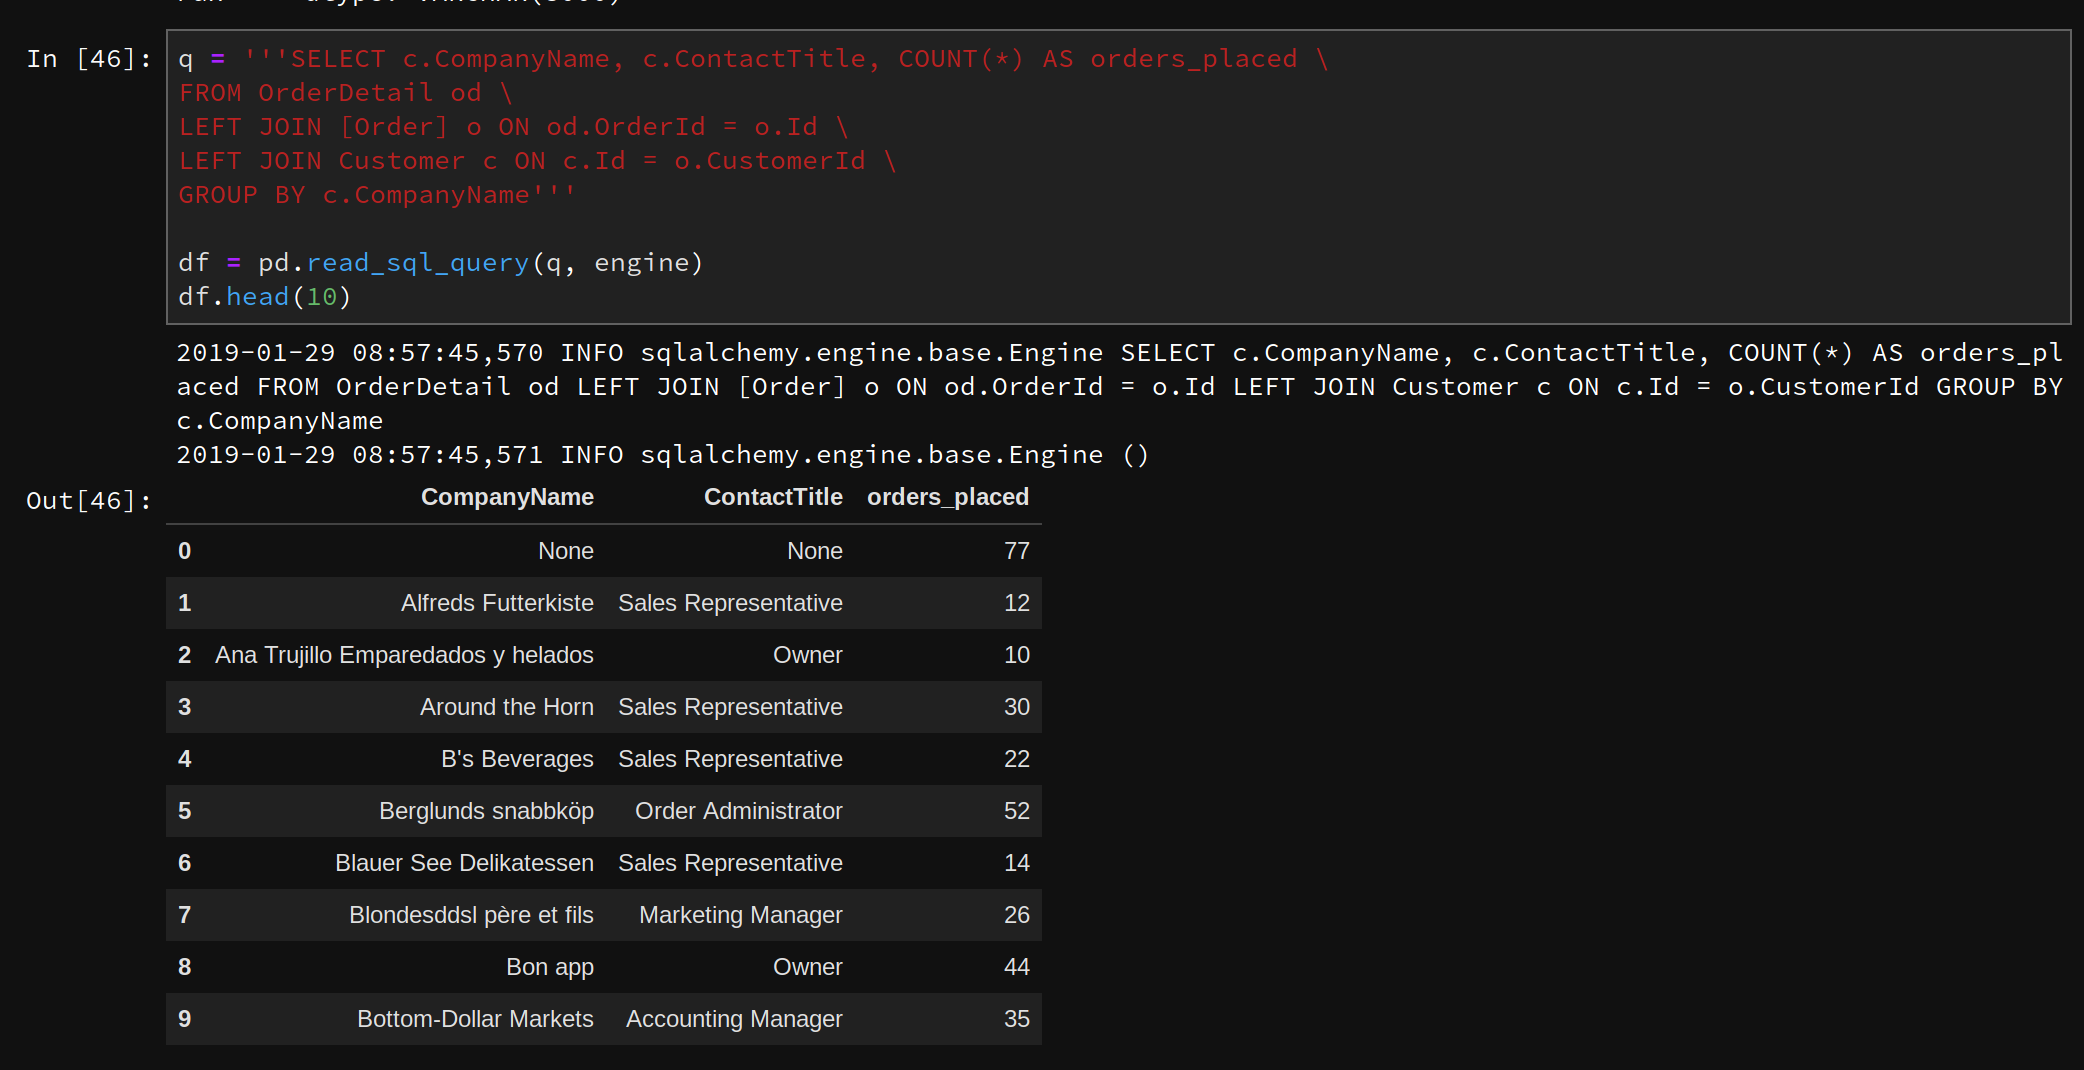
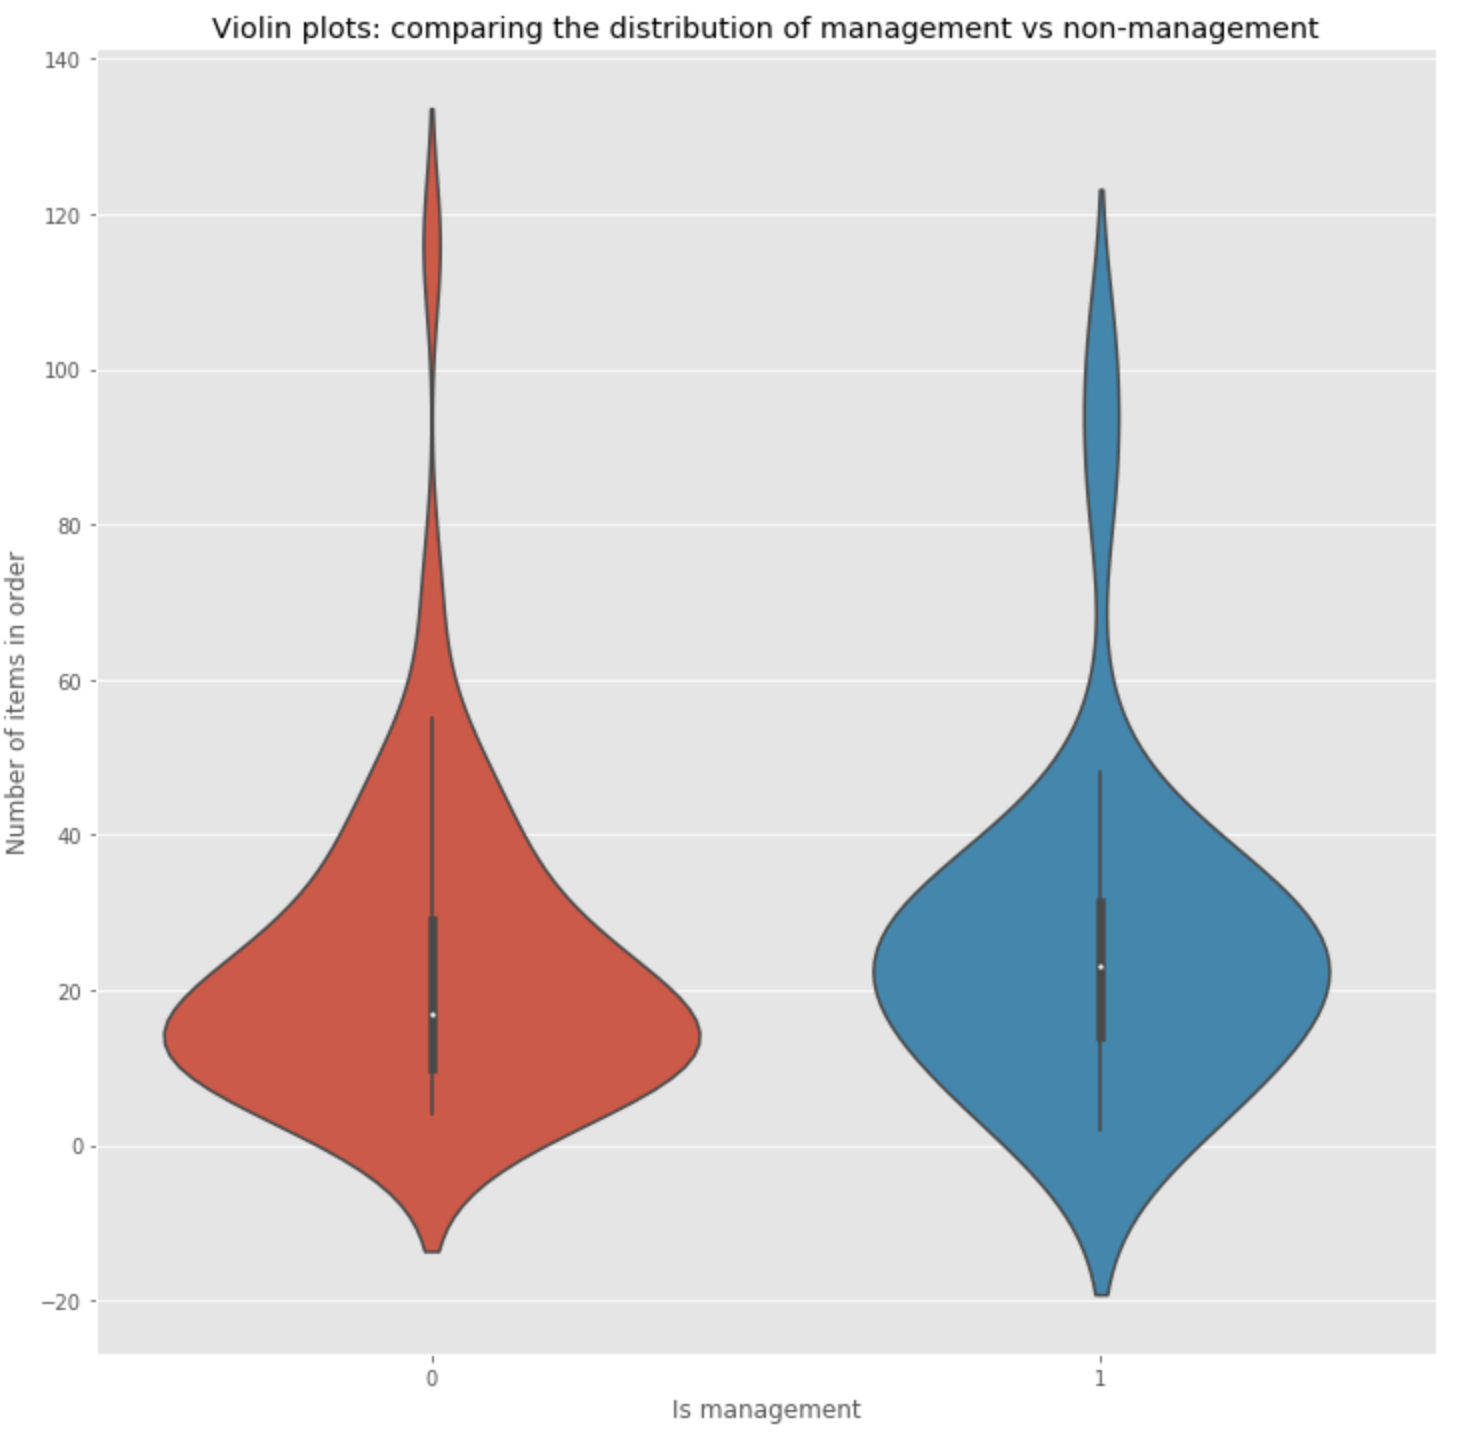
3) Does having ‘manager’ in your title effect the amount a customer orders?
H null: Having manager in your title, the amount a customer orders doesn’t change
H alt: Having manager in your title, the amount a customer orders changes
alpha = 0.05
3) Results
- Failed to reject the null hypothesis. As a customer having manager in your title, the quantity ordered doesn’t signifgantly change compared to customers without that title
- p-value > alpha :: 0.2241 > 0.05 - Mann-Whitney
- p-value > alpha :: 0.5416 > 0.05 - T-test
- Further testing: change the criteria in which the customers are grouped. Include ‘owner’ title with the ‘manager’ title and compare results.
4) Is there a difference in quantity of products given their average shelf life?
H null: The quantity of perishable products ordered is the same as the quantity of non-perishable products ordered
H alt: The quantity of perishable products ordered is the different as the quantity of non-perishable products ordered
alpha = 0.05

4) Results
- Failed to reject the null hypothesis. The quantity ordered of perishable items doesn’t significantly change The quantity ordered of non-perishable items
- p-value > alpha :: 0.3518 > 0.05 - Mann-Whitney
- p-value > alpha :: 0.8436 > 0.05 T-test
- Further testing: Reach out to the data engineers and obtain ‘good until’ dates and use that as a metric
References:
https://www.ncbi.nlm.nih.gov/pmc/articles/PMC3116565/
https://pythonfordatascience.org/